World Cup Fatigue Index
My view of the players at the World cup through performance data

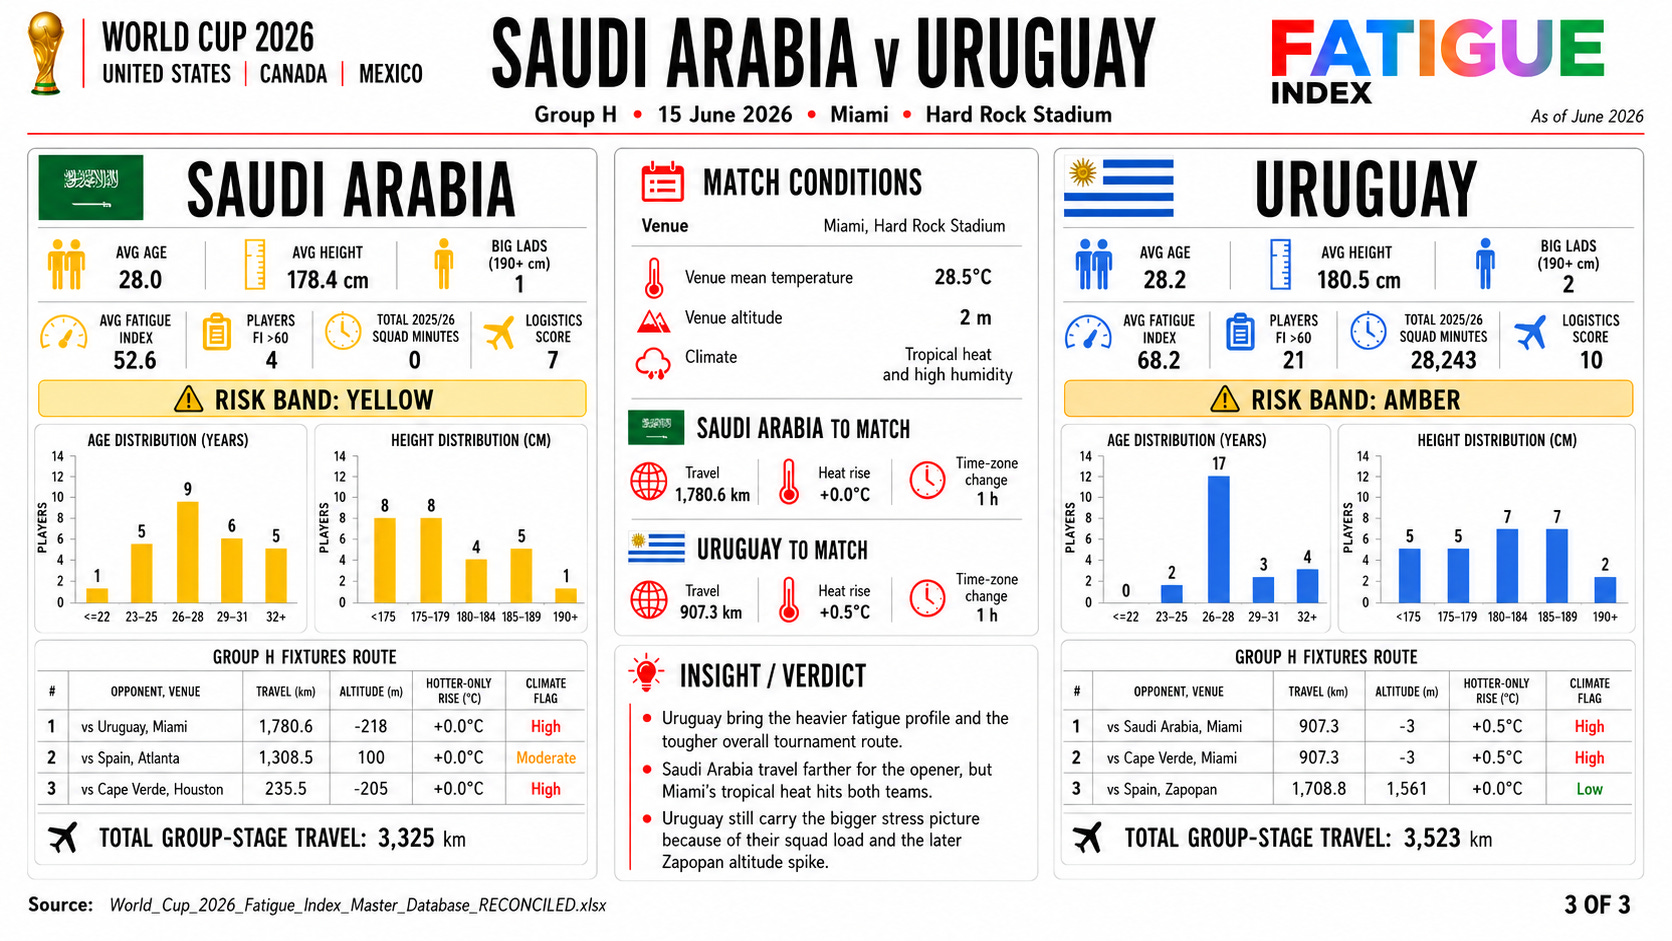
The World Cup is a football tournament, but it is also a squad-shape problem.
You can have the best XI in the group and still arrive with the wrong balance. Too many players at the wrong end of the age curve. Not enough size. Too many miles in the legs. Too many players who have spent the last four years being wrung out by club football, qualifiers, internationals, Champions League, domestic cups, travel and recovery debt.
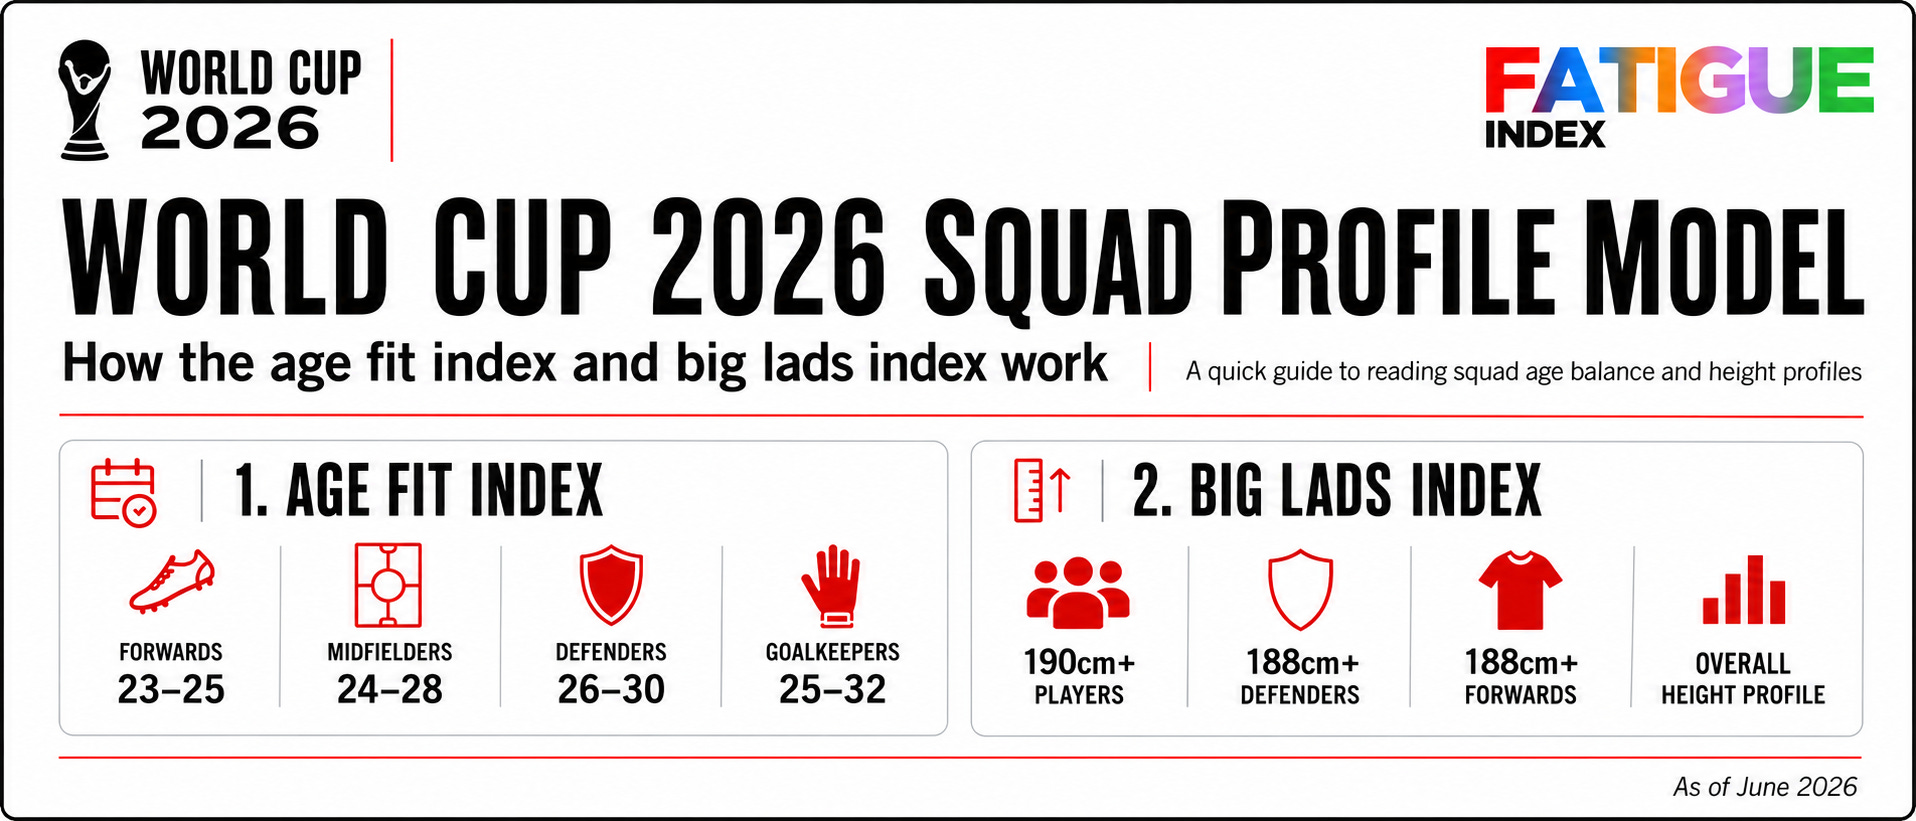
So I built the Squad Profile Model to answer a simple question.
What does each squad actually look like?
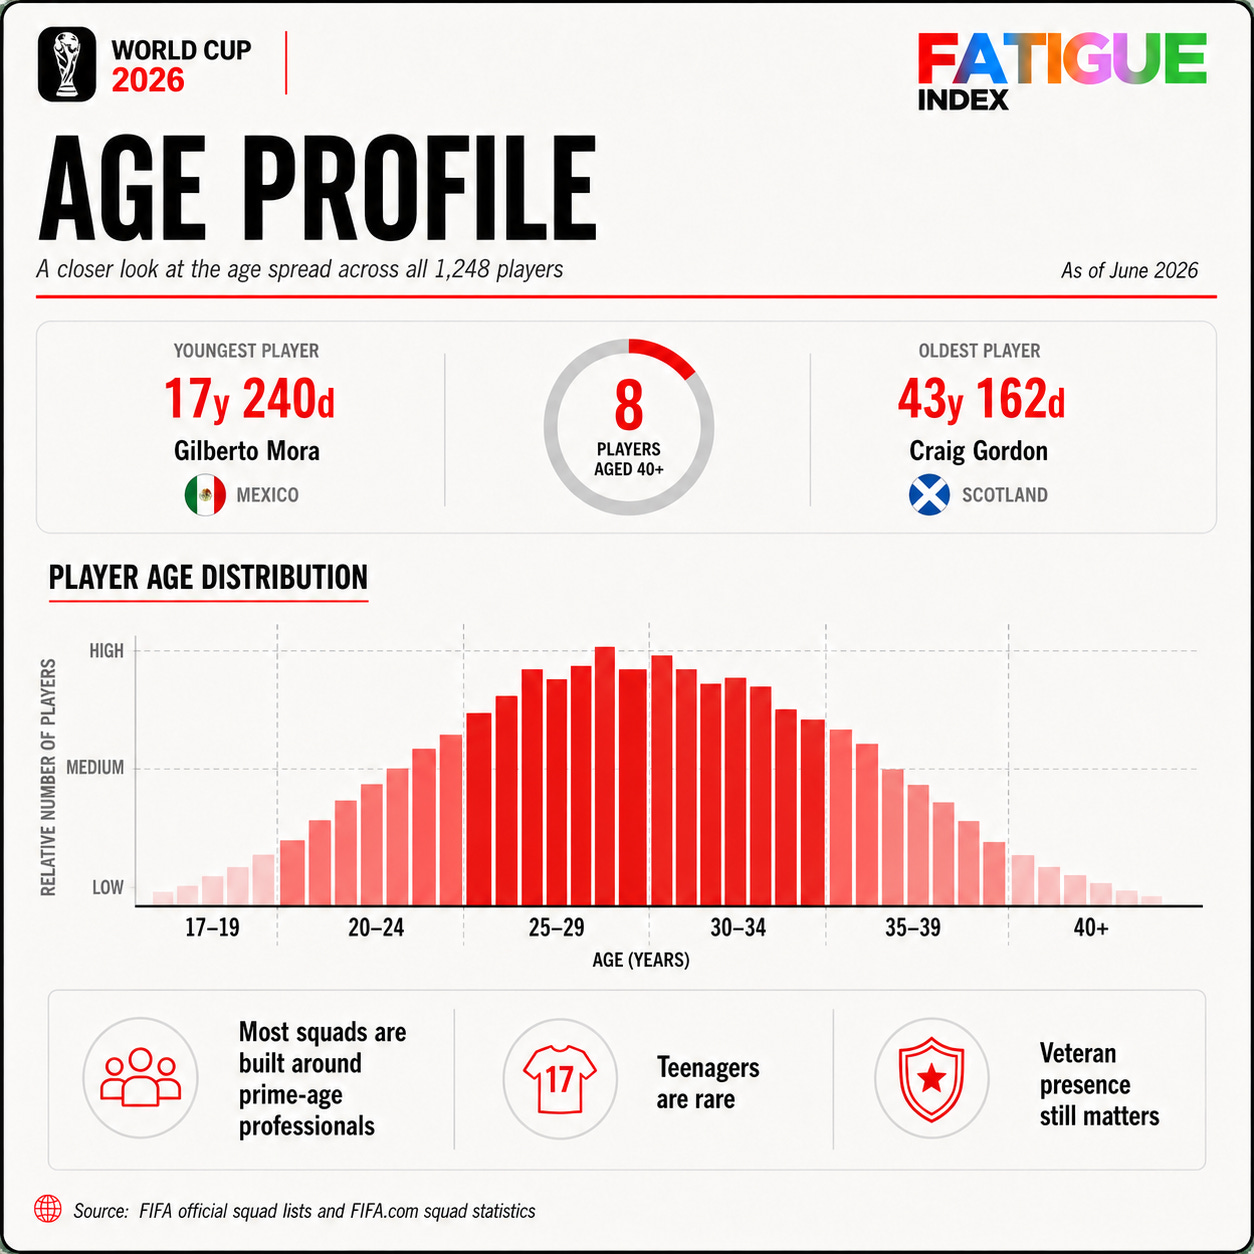
The first bit is age.
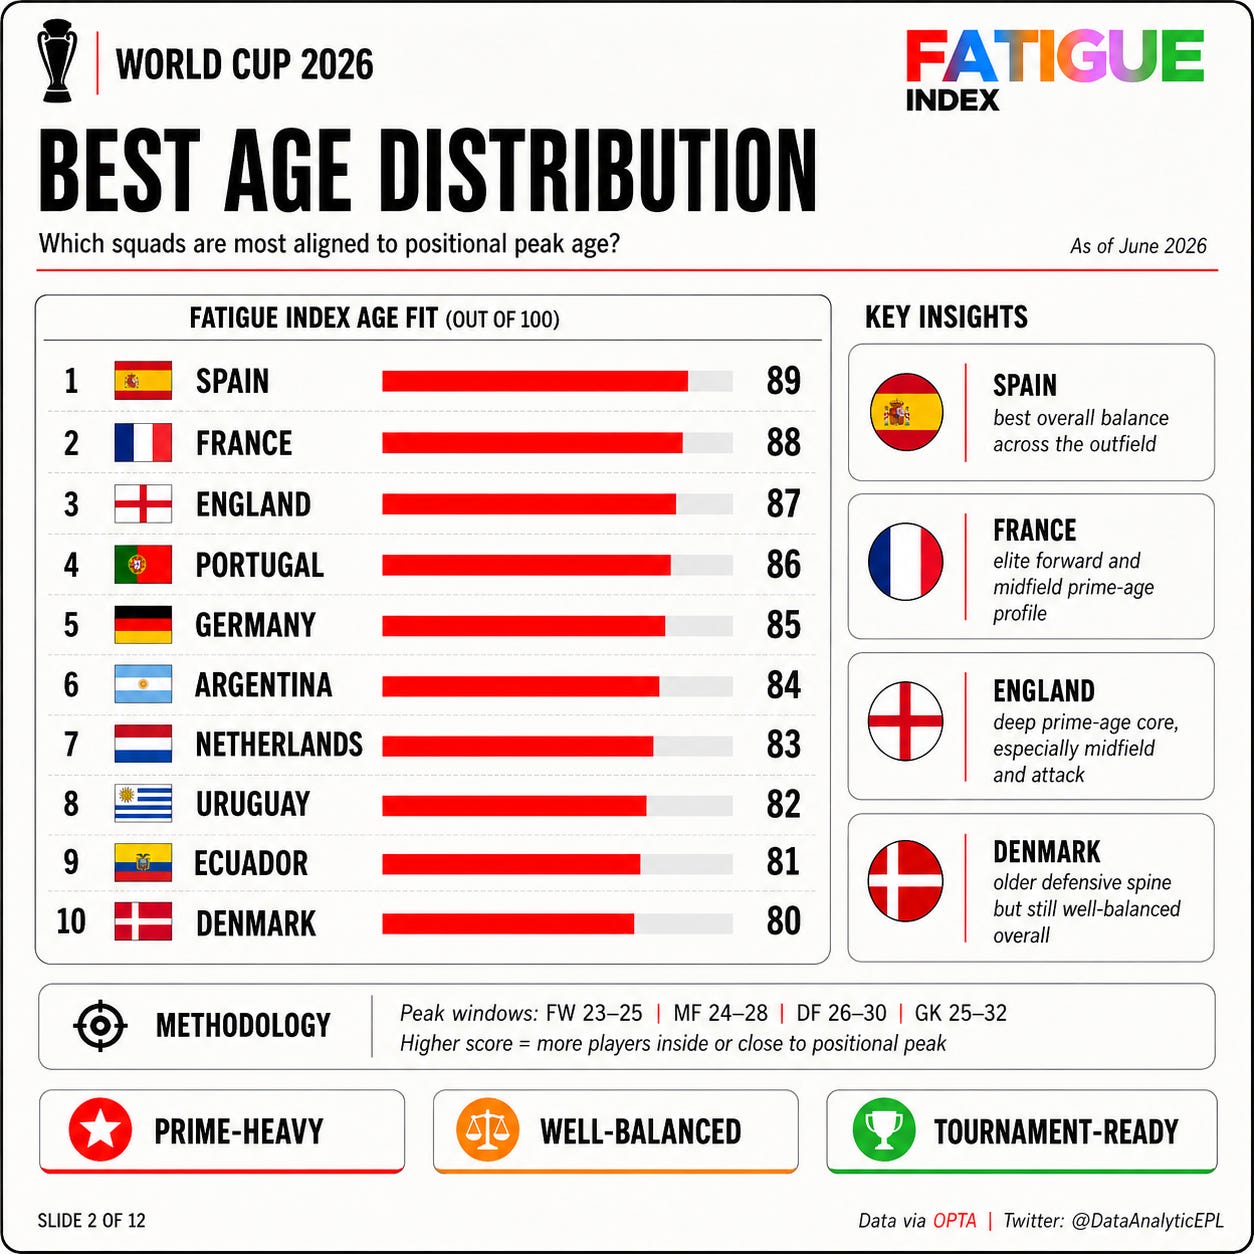
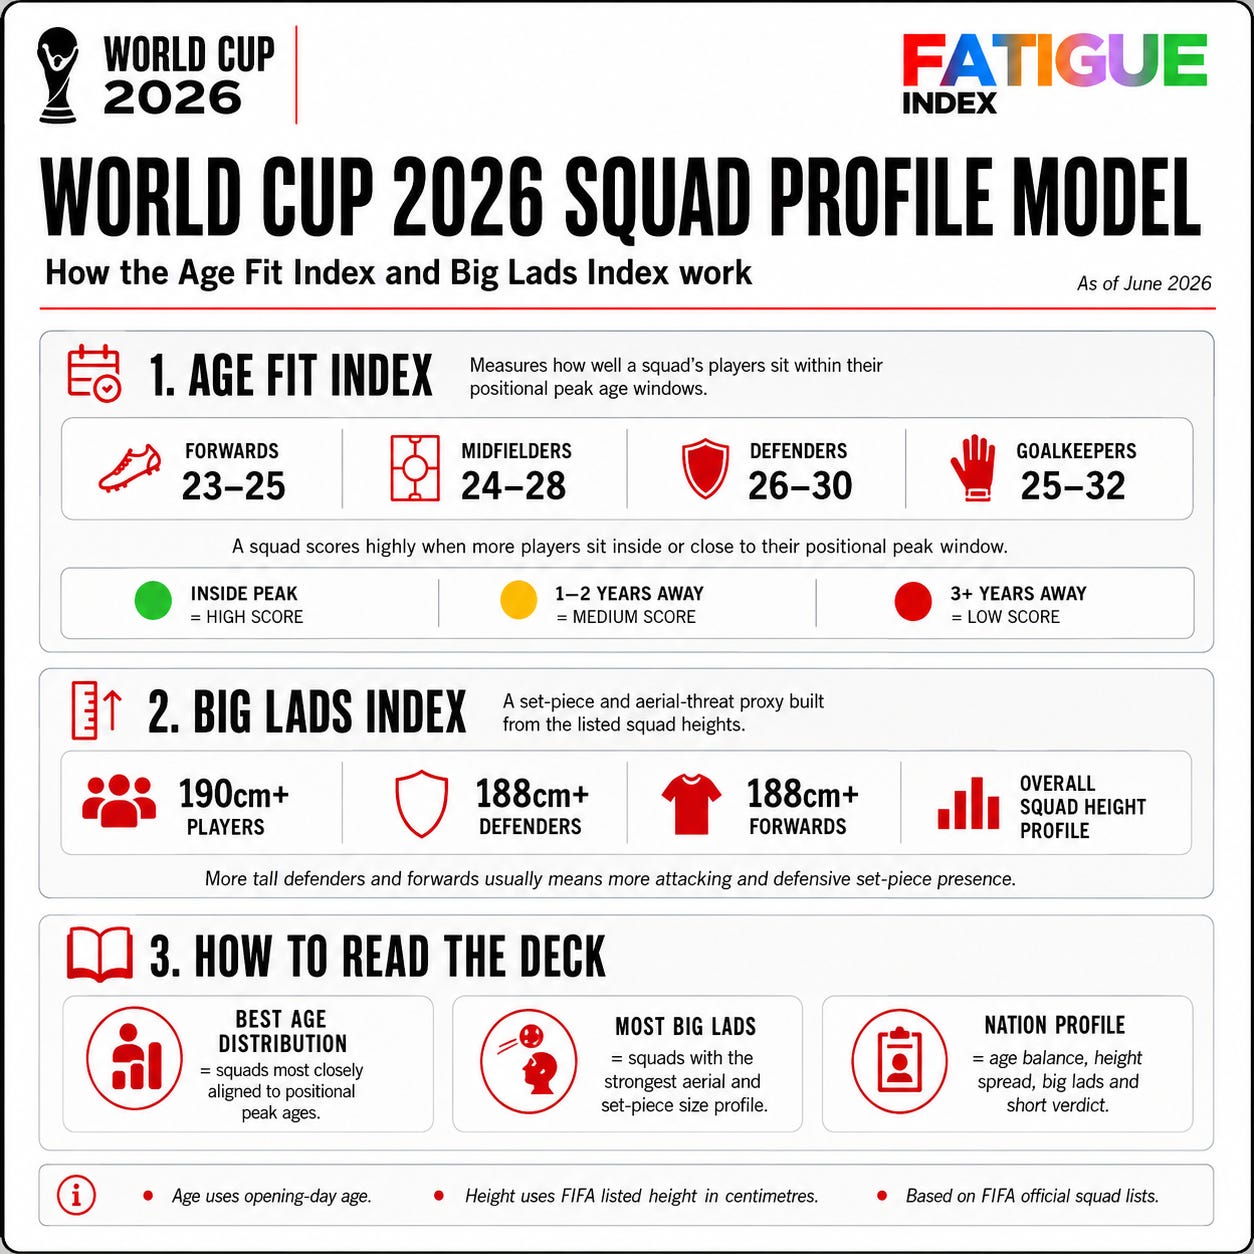
I’m using opening-day age, because that gives every player the same reference point. Then I compare players to broad positional “peak age” windows.
Forwards, 23 to 25.
Midfielders, 24 to 28.
Defenders, 26 to 30.
Goalkeepers, 25 to 32.
A young forward can still be brilliant. An older midfielder can still run the game. We all know keepers play to their own rules, look at Neuer. Football is full of oddities and exceptions.
But across a 26-man squad, the age shape gives you a decent clue.
Do you have young legs but less tournament experience?
Do you have a mature defensive unit?
Is the midfield in the zone where players usually combine enough running power with enough game knowledge?
Is the squad packed with players who are already on the wrong side of the usual physical curve for their position?
That is what the Age Index is trying to show.
Players inside their positional window score well. Players one or two years outside it sit in the middle. Players three or more years away pull the score down.
It does not tell you who is good. It tells you whether the squad has an age profile that looks built for this type of tournament.
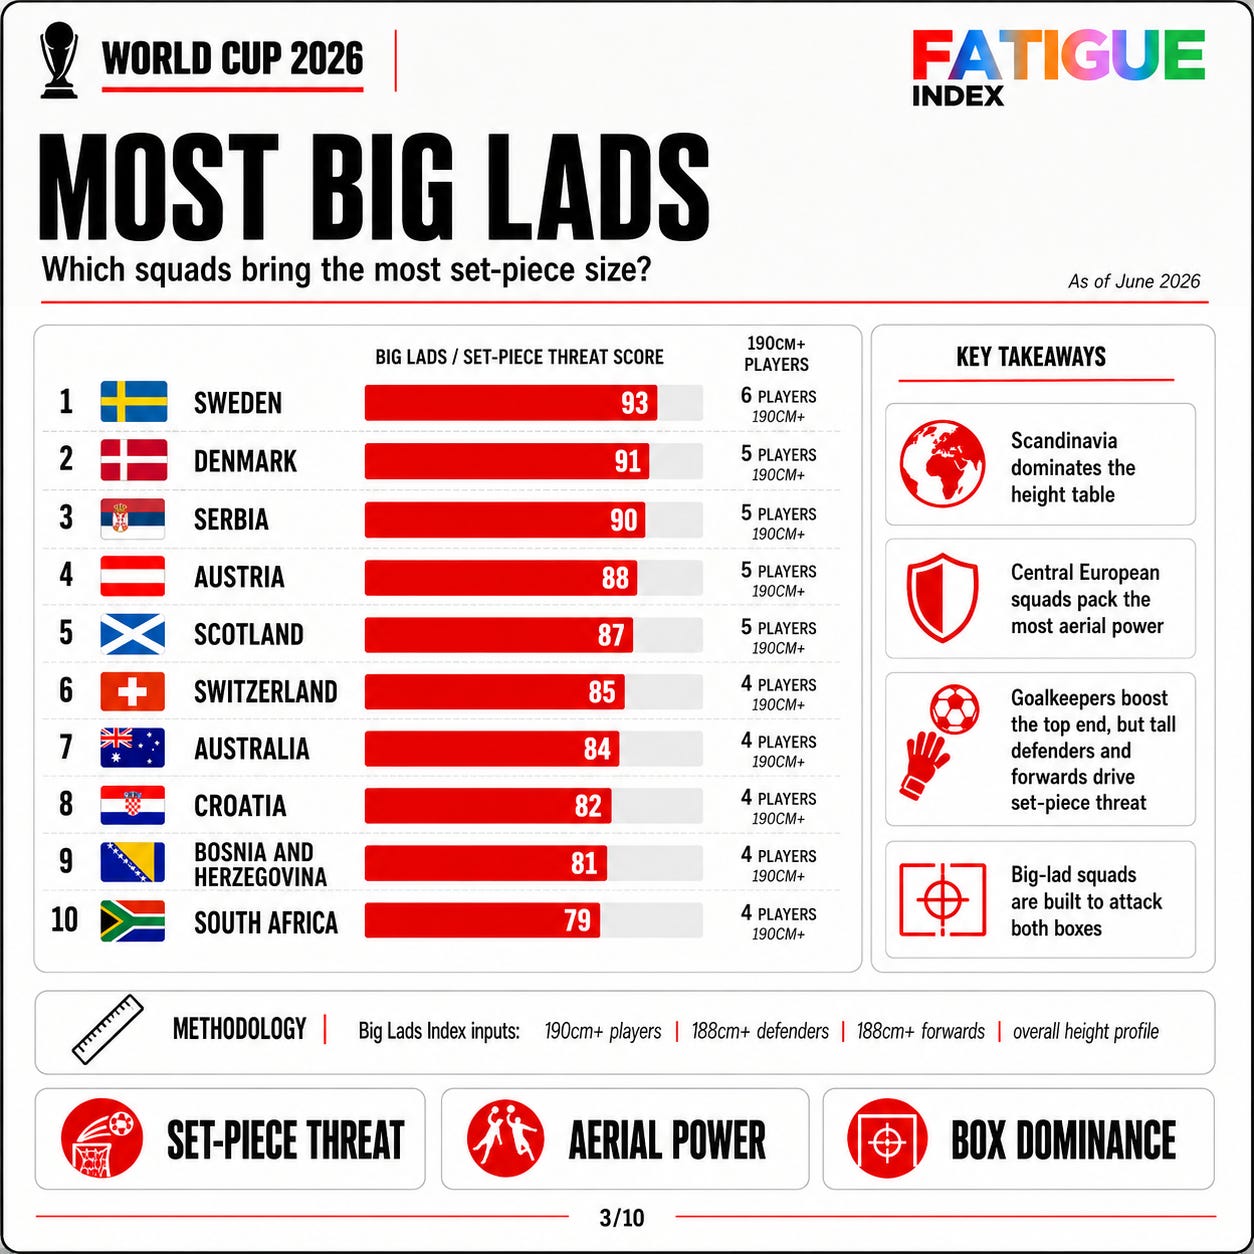
The second bit is the Big Lads component.
This is the blunt instrument in the model, and I’m happy with that.
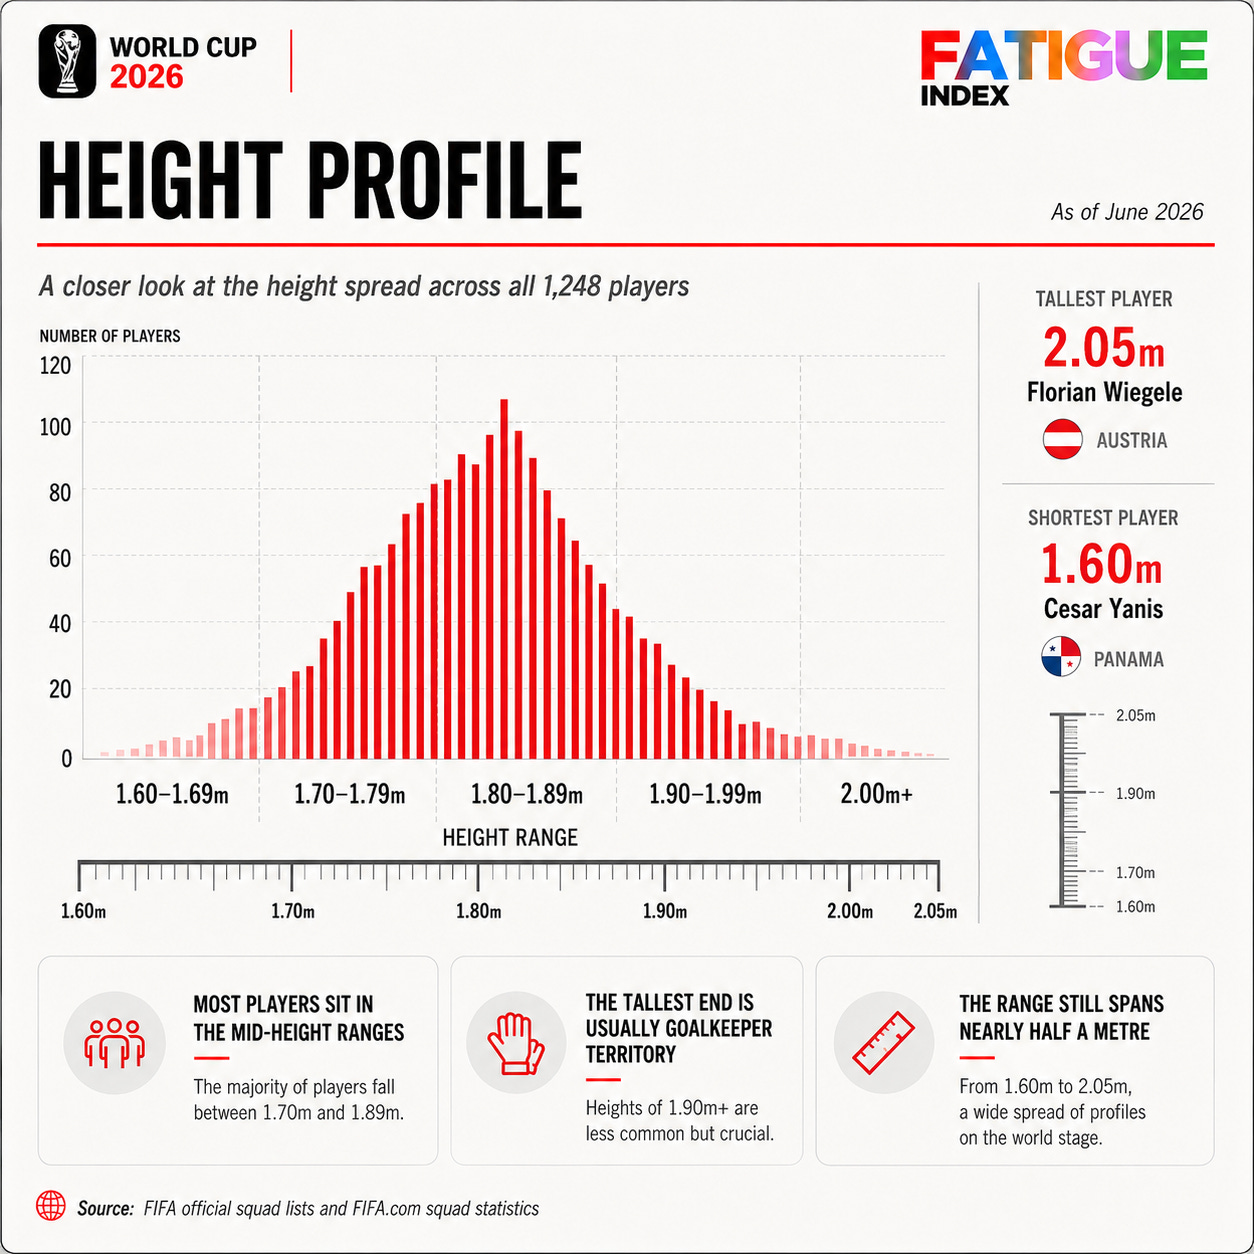
Height matters. We just spent a year watching Arsenal batter the Premier League with Set Pieces, then the whole league try to model them.
It is not everything. Timing matters. Jump strategy matters. Aggression matters. Delivery matters. Blocking matters. Some 183cm centre-backs attack the ball like a missile. Some 193cm players attack it like they have been asked to fetch something from a pond.
But tournament football always drags you back to boxes.
Late corners.
Deep free-kicks.
Back-post defending.
Set-piece threat when you are chasing a goal.
Set-piece security when you are protecting one.
So the Big Lads Index looks at the height profile of the squad.
Players 190cm and above.
Defenders 188cm and above.
Forwards 188cm and above.
Then the overall squad height spread.
It is a quick proxy for aerial presence and set-piece tools. It will not explain the whole tournament, but it gives us a useful starting point.
That is all this profile model is meant to do.
It gives us the shape of the squad before the heavier Fatigue Index layers go on top.
Age.
Height.
Big lads.
Position balance.
Then we can add the tastier stuff.
Season minutes.
Minutes since the last World Cup.
Year-on-year load jumps.
Heat.
Humidity.
Altitude.
Travel.
Time zones.
Fixture spacing.
That is where the tournament starts to look different for every country.
One squad might have a lovely age profile but a horrible route.
Another might have loads of size but an old spine.
Another might look young and fresh until you realise half of them have played monster minutes since Qatar.
This model is the front door.
It tells us what each squad brings into the tournament before the tournament starts taking things away.
My plan is to post a slide on each fixture before every game. Ill use this stuff in my articles looking at different stories the data shows throughout the next few weeks. I might even add the Running numbers to each slide.